How to read a conservation unit in Yvynation, from the inside out
Pick a unit from Brazil's National Register of Conservation Units and Yvynation returns forty years of MapBiomas, the forest loss measured by Hansen, a timeline of clearing, regrowth and fire, and the same reading for the 10 km around it. This walkthrough opens a real unit and follows where each number comes from.
Loading the example from Earth Engine (the first visit can take up to a minute)…
—area of the unit (CNUC geometry) measured
—native vegetation inside, latest year
—native vegetation around
—of tree cover lost inside, 2001–2024 (Hansen) measured
measured computed from satellite data or from the catalogue's geometry.
missing an analysis that did not respond this time.
1
Pick the unit from the CNUC catalogue
Yvynation holds the 3,247 conservation units in the CNUC — federal, state and municipal — with category, group and level. The group changes the reading: under strict protection no direct use is expected; under sustainable use, as in extractive reserves and national forests, the management plan says which uses belong there.
In the app: on the home page, the Conservation Units Analysis card; in the sidebar, Study area, with the search and the list. Direct link: /?modo=unidade-conservacao&busca=….
2
Ten kilometres around, for comparison
A number inside the area only means something next to what happens outside it. As soon as the area is chosen, Yvynation builds a 10 km ring outward from the boundary on its own and runs the same analyses in it.
In the app: the Buffer Zone panel in the sidebar: the 10 km ring comes with the area, and another radius can be requested under Create.
3
Inside and out, in the latest year
MapBiomas Collection 11 classifies every 30 m pixel in Brazil every year. Each class's area comes from each pixel's true size, not a fixed 900 m². The bars compare each class's share inside and around.
In the app: the Run all analyses button at the top, and the MapBiomas tab under Results.
4
Forty years in three snapshots
The same sum in 1985, 2005 and 2025: how much of each zone is native vegetation (forest, savanna and grassland). The map shows the series' first year, to compare with the previous step.
In the app: the Compare tab (two years side by side) and the Multi-window tab (several years at once).
5
What became what
The diagram links each 1985 class to the class the same pixel had in 2025. A band linking a class to itself is what stayed the same; the bands that cross are the change.
In the app: the Compare tab, with the transition matrix, and the Treemaps tab, one per class.
6
A second opinion on the forest
Hansen/UMD measures something else: tree cover, not land-use classes. It starts from the 2000 canopy, dates the year each pixel lost its trees and adds an undated gain. When MapBiomas and Hansen tell the same story, the story is firmer.
In the app: the Hansen GFC tab, and the Hansen/GLAD tab for a single year's cover.
7
Year by year: clearing, regrowth and fire
The timeline brings together four yearly series: primary vegetation clearing and regrowth (MapBiomas Deforestation and Secondary Vegetation), canopy loss (Hansen) and fire scars (MapBiomas Fire).
In a sustainable-use unit, part of the change may be use the management plan allows. Large-scale pasture inside an extractive reserve is not.
In the app: the Timeline tab, which can overlay the political context (federal and state governments) and ENSO.
8
The same line, inside and out
To compare zones of different sizes, clearing becomes hectares per 1,000 hectares of each zone. If the outside line rises and the inside one does not, the boundary is holding; if both rise together, the pressure has already crossed it.
In the app: the Timeline tab, with the buffer zone switched on.
9
Report, tables and maps to take away
Everything in the tabs can leave the app: a PDF report, CSV tables, PNG maps and charts, all in one ZIP. The data Yvynation produces are open (CC BY 4.0), with the source of each layer.
In the app: the Export & Download panel below the results, and How to Cite at the top.
yvynation.umaterra.com.br
Loading…measured
Computing the example in Earth Engine (the first visit can take up to a minute)…
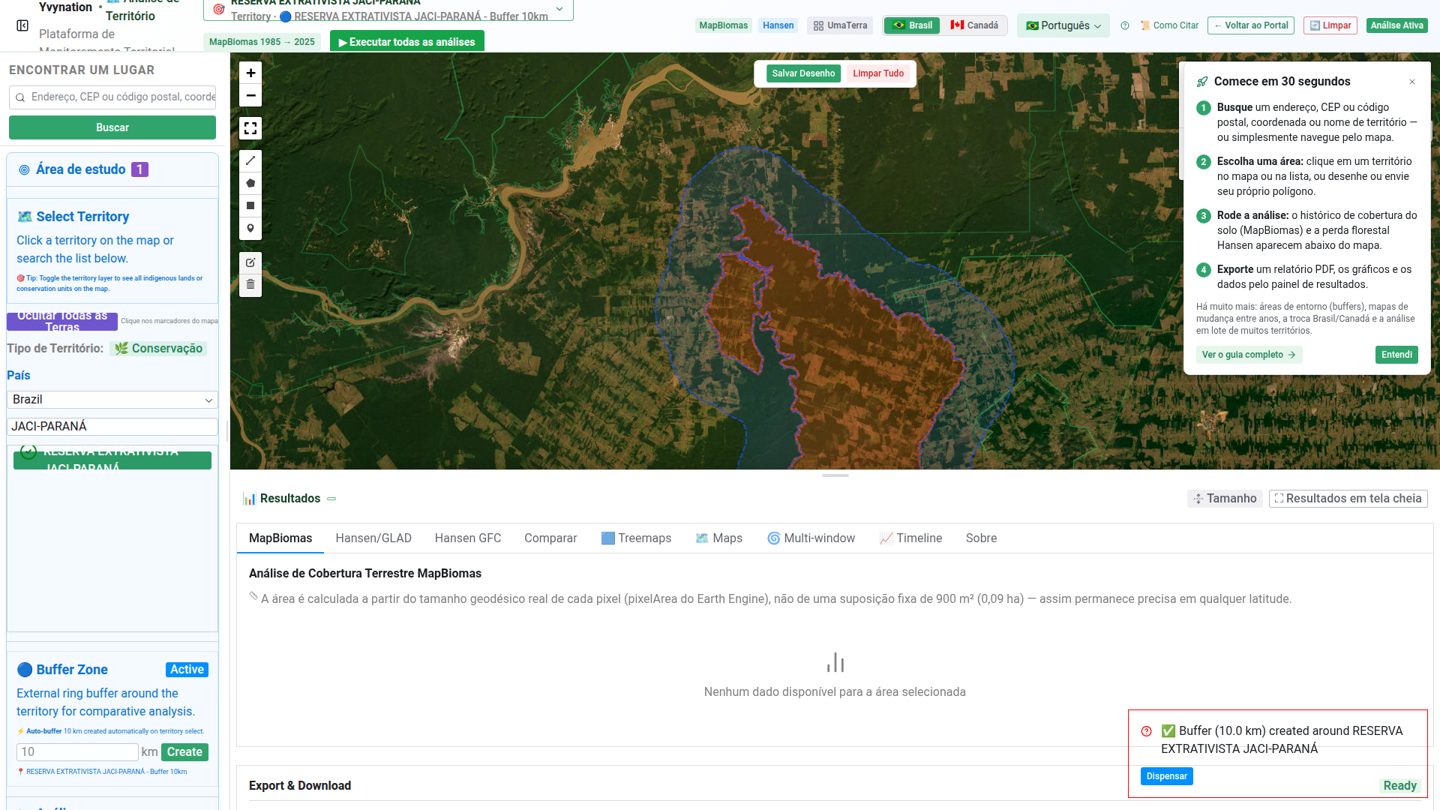
The app with the Jaci-Paraná extractive reserve selected and its 10 km zone. screenshot
What Yvynation does not say
It does not judge the management plan. The satellite shows cover; whether a use is allowed depends on the category, the management plan and permits, none of which are here.
It does not say who cleared. Embargoes, fines and lawsuits are left out. For IBAMA embargoes, see Naturametrics.
The 10 km zone is not the legal buffer zone. It is a comparison ring, the same for every unit. The official buffer zone, where there is one, comes from the management plan.
The boundary is the CNUC's. Units that were recategorised, degazetted or had their limits changed by law may be drawn differently today.
It cannot see below 30 m. Selective logging and degradation under the canopy escape both MapBiomas and Hansen.
The CNUC is the national register of the units created under Brazil's National System of Conservation Units (SNUC, Law 9,985/2000), published by the Ministry of the Environment with ICMBio, which manages the federal ones. It also lists state and municipal units. Like the Indigenous lands' layer, it is an official, enumerable boundary: units can be compared across the country and run in batch. Biondo et al., Registry, coordinate, cadastre (manuscript in preparation, 2026).
The ring is exclusive: it starts at the boundary and leaves the area itself out, so no hectare is counted in both zones. Even so, it is a comparison region, not a counterfactual. Clearing pushed from inside to outside (leakage) inflates the contrast, and protected areas tend to be placed on land that was less threatened to begin with (Ewers & Rodrigues, 2008; Joppa & Pfaff, 2009). So the screen compares, but does not credit the difference to the boundary. Biondo et al., Registry, coordinate, cadastre (manuscript in preparation, 2026).
Area comes from pixelArea(), each pixel's true area, not from the pixel count times 0.09 ha. MapBiomas pixels are measured in degrees, and their area shrinks away from the Equator. The convention started in Naturametrics and reached Yvynation in August 2026, one of the modules that move between the suite's three tools. Biondo et al., Registry, coordinate, cadastre (manuscript in preparation, 2026).
MapBiomas and Hansen have to stay separate because they measure different things. An April 2026 export put 305,250 ha of Hansen loss in 2024 inside the Kayapó Indigenous Land, about two-thirds of all the 2001–2023 loss in a single year. It was a wildfire scar, not clearing: Hansen's loss layer records canopy loss from any cause (Curtis et al., 2018). Biondo et al., Registry, coordinate, cadastre (manuscript in preparation, 2026).
Very large units take a detour. Above 1,000,000 ha, Yvynation splits the geometry into four quadrants, because Earth Engine timed out computing the ring for areas above about 2 million ha. Before building the PDF, the batch adds the four pieces' classes, transitions and yearly loss back together and recomputes the percentages, so the report describes the unit the register names. The per-quadrant tables stay in the ZIP. Biondo et al., Registry, coordinate, cadastre (manuscript in preparation, 2026).